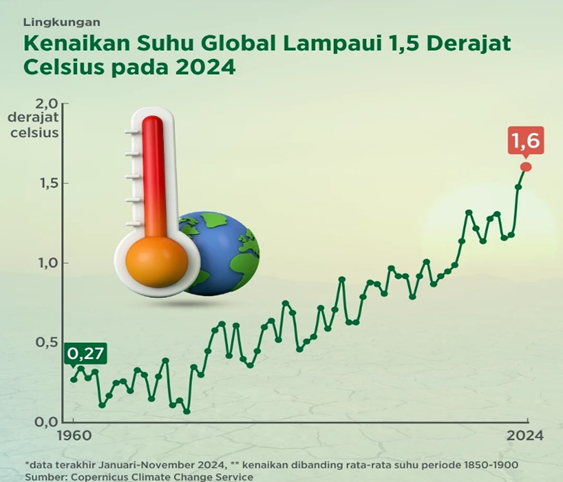
- The European Union’s Copernicus Climate Change Service predicts that 2024 will be the hottest year in the world. In 2024, the earth’s average surface temperature will range from 1.29°C to 1.6°C.
- Researchers also predict that by 2024 the level of carbon concentration in the atmosphere will reach 422.5 ppm or 52% higher than the pre-industrial period.
- The consequences that the Earth will face; Increasing Ocean Temperature, Degradation of Earth’s Snow Cover, Increase in Tropical Cyclone Frequency, Hydrological Anomalies and Sea Level Increase.
Climate change continues to shape global weather patterns, bringing more extreme conditions year after year. Scientists have been closely monitoring temperature trends, and recent data suggests that 2024 could break yet another heat record. As rising global temperatures become a growing concern, it is essential to understand the factors driving these changes and their potential consequences.
Earth’s Climate Conditions in 2024
The European Union’s Copernicus Climate Change Service predicts that 2024 will be the hottest year on record. The Earth’s average surface temperature in 2024 is expected to range between 1.29°C and 1.6°C above pre-industrial levels. This would be the highest recorded global temperature since 1850, surpassing the previous record set in 2023 by 0.10°C.
Additionally, several climatic phenomena will occur in 2024, including El Niño, which is expected to last from December 2023 to July 2024, warming the surface waters in the eastern Pacific Ocean. Following this, La Niña is projected to develop in early August 2024, bringing cooler temperatures towards the end of the year.
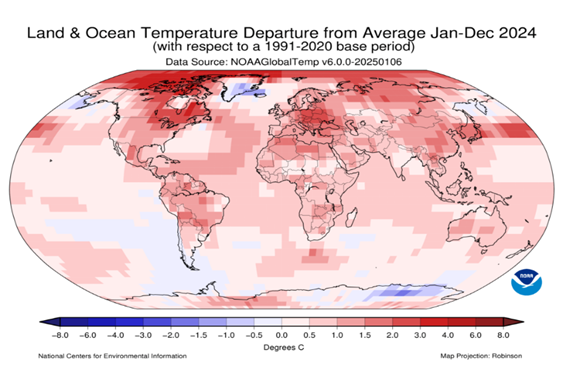
A number of cities worldwide will experience rising average temperatures, with heat waves occurring during the dry season in tropical countries and during summer in subtropical and temperate regions.
Baca Juga
Causes of Global Warming
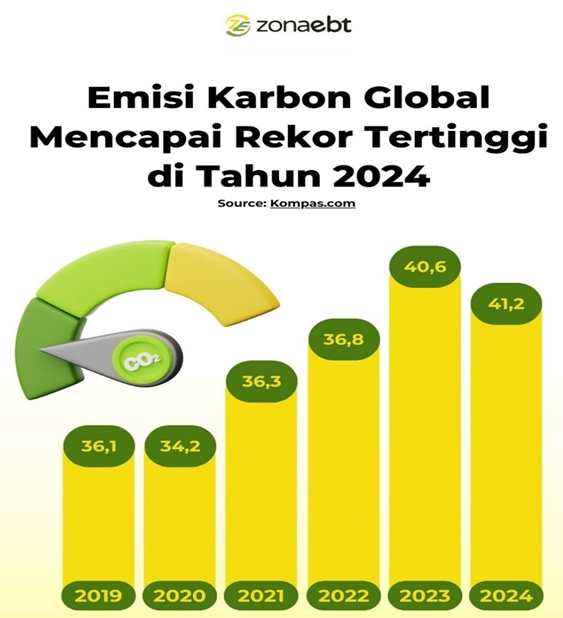
The World Meteorological Organization (WMO)’s Climate Development Report states that concentrations of the three main greenhouse gases methane, carbon dioxide, and nitrous oxide have continued to increase from 2023 to 2024. Methane emissions have risen by 165% compared to the pre-industrial period, followed by a 51% increase in carbon dioxide emissions and a 24% increase in nitrous oxide emissions. Additionally, researchers estimate that by 2024, atmospheric carbon concentration levels will reach 422.5 ppm, which is 52% higher than in the pre-industrial period.
In Indonesia, carbon emissions come from several key economic sectors and human activities. The manufacturing industry recorded the highest emissions, reaching 340.71 million tons of CO2, followed by electricity and gas procurement with 297.22 million tons of CO2. The transportation sector contributed 81.08 million tons of CO2, followed by agriculture and fisheries with 86.5 million tons of CO2, the waste management sector with 30.84 million tons of CO2, and the mining/quarrying sector with 29.8 million tons of CO2.
Globally, several factors significantly contribute to total carbon emissions in 2024. According to Le Quéré, emissions have increased in countries with high energy consumption, such as India and China, to support industrial needs and growing populations. There has also been a 2.4% rise in gas usage, mainly in China, and a 0.9% increase in fuel oil consumption, driven by a surge in international air travel. Additionally, the El Niño phenomenon in 2023-2024 has worsened deforestation, leading to higher carbon emissions, particularly in regions such as Brazil and Indonesia. Dr. Glen Peters, a researcher at the International Centre for Climate Research, noted that while global fossil fuel CO2 emissions may be nearing their peak, countries worldwide continue to seek ways to burn more fossil fuels each year.
Baca Juga
Consequences That The Earth Will Face
In 2024, the heat content of the upper ocean, stored in the top 2,000 meters, reached a record high. This increase is a crucial climate indicator, as the oceans absorb 90% of the excess heat from the Earth’s system. The warming of ocean waters contributes to more extreme weather patterns, including rising sea levels and intensified storms.
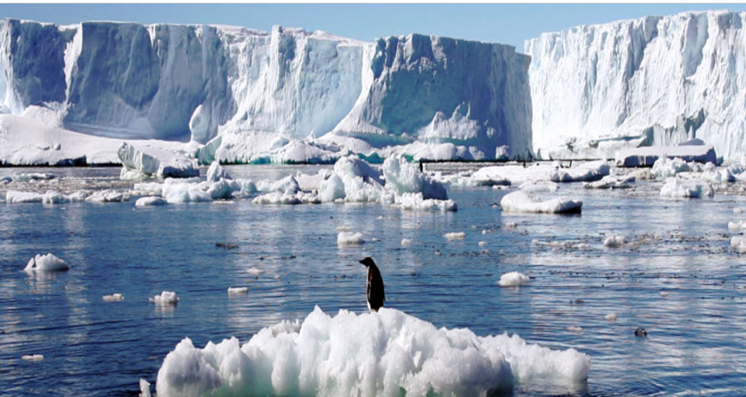
Meanwhile, the Earth’s snow cover has also experienced degradation. In the Northern Hemisphere, the average snow cover area in 2024 is estimated to be 9.2 million square miles, which is slightly below the long-term average. The snow cover fluctuates throughout the year, with 18.1 million square miles recorded in January, and reaching its lowest extent in August at 1.0 million square miles. These figures, though close to average, indicate a gradual reduction in snow coverage over time.
The frequency of tropical cyclones has also increased, with 85 named hurricanes recorded globally in 2024. Among them, 42 storms intensified to tropical cyclone strength, reaching speeds of 74 mph or more, while 23 storms escalated into major tropical cyclones with wind speeds exceeding 111 mph. Notably, four hurricanes reached Category 5 status on the Saffir-Simpson scale, with winds surpassing 157 mph.
Additionally, hydrological anomalies have been observed worldwide. Certain regions, such as western and southern North America, Canada, the Horn of Africa, the Arabian Peninsula, and southern Central Asia, have experienced drier-than-average conditions. Australia and Chile have also faced prolonged dry spells, contributing to widespread bushfires. In Europe, parts of southeastern and northern Spain, the Maghreb, southern England, Ireland, eastern Iceland, most of Scandinavia, northwestern Russia, and the eastern Balkans have reported below-average rainfall. Conversely, some regions, including the western and southeastern United States, most of Eurasia, southeastern South America, southeastern Africa, and northern and eastern Australia, have experienced excessive rainfall and flooding.
The rise in global sea levels continues to be a pressing concern, with an increase of 111 mm recorded since 1993. This gradual rise in sea levels is attributed to the melting of polar ice caps and the expansion of seawater due to rising temperatures. These climate trends highlight the urgent need for sustainable environmental policies and climate adaptation strategies to mitigate future impacts.
#zonaebt #EBTHeroes #Sebarterbarukan
Editor : Alfidah Dara Mukti


